

This repo aims to practice with ELK Stack thanks to a simple SpringBoot application. Following this repo, you are going to:
- Monitor a SpringBoot application log and API beats with the ELK Stack.
- Practice with Kibana Dashboards and indexing tools.
- Follow each ELK setup and understand connections and events setup.
Click here to get more info on ELK Monitoring.
docker-compose up -d --build- Go to http://localhost:5601/
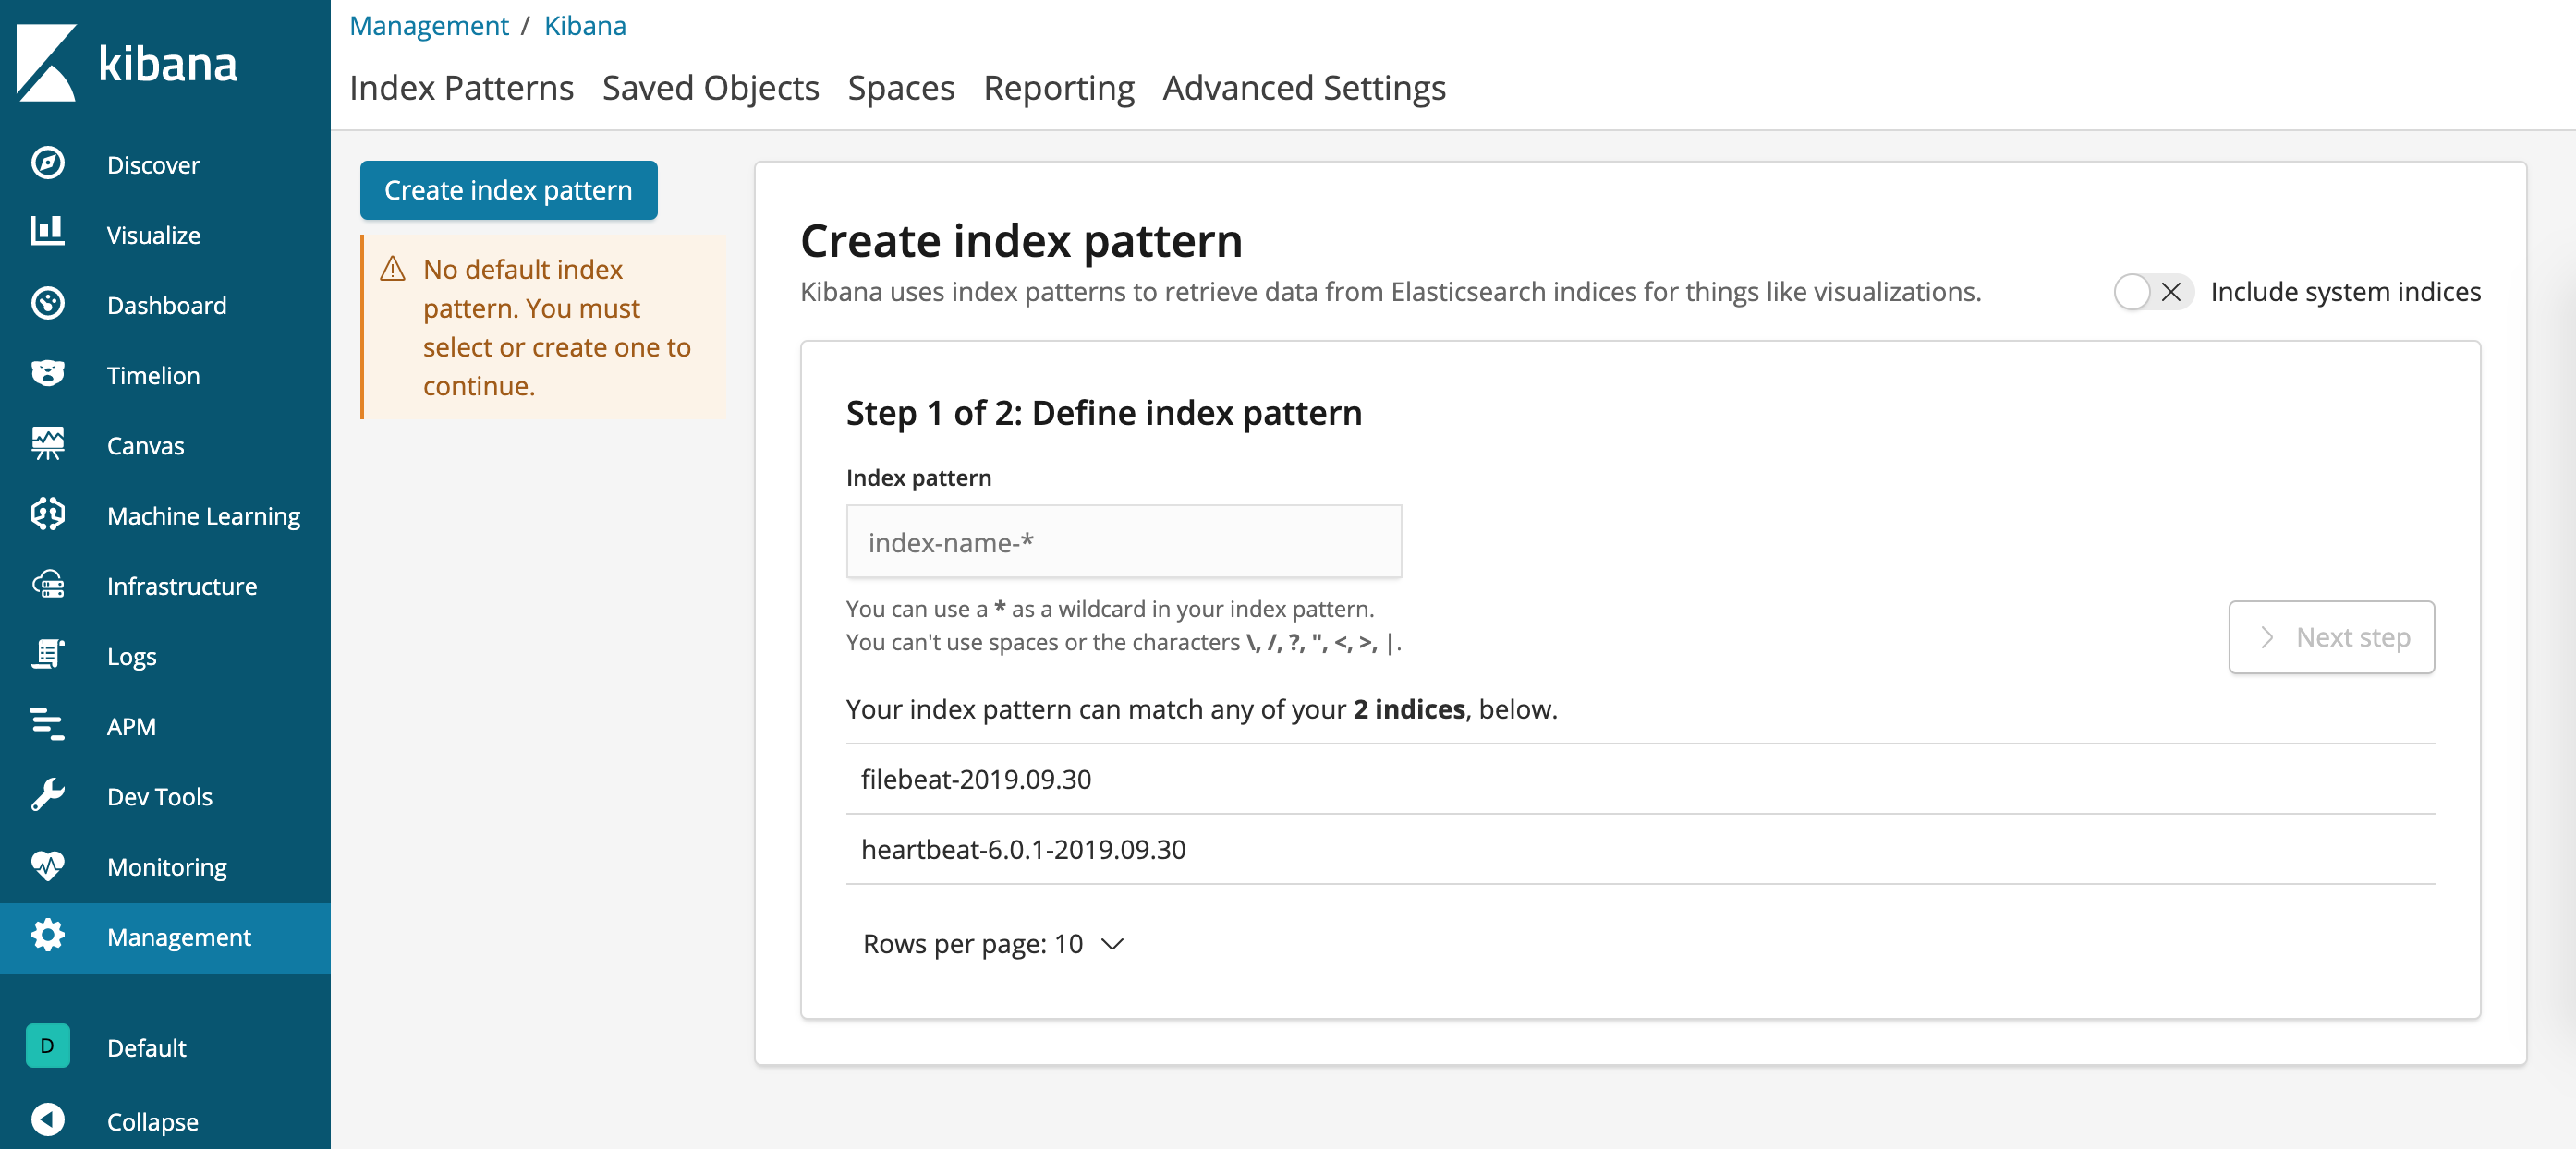
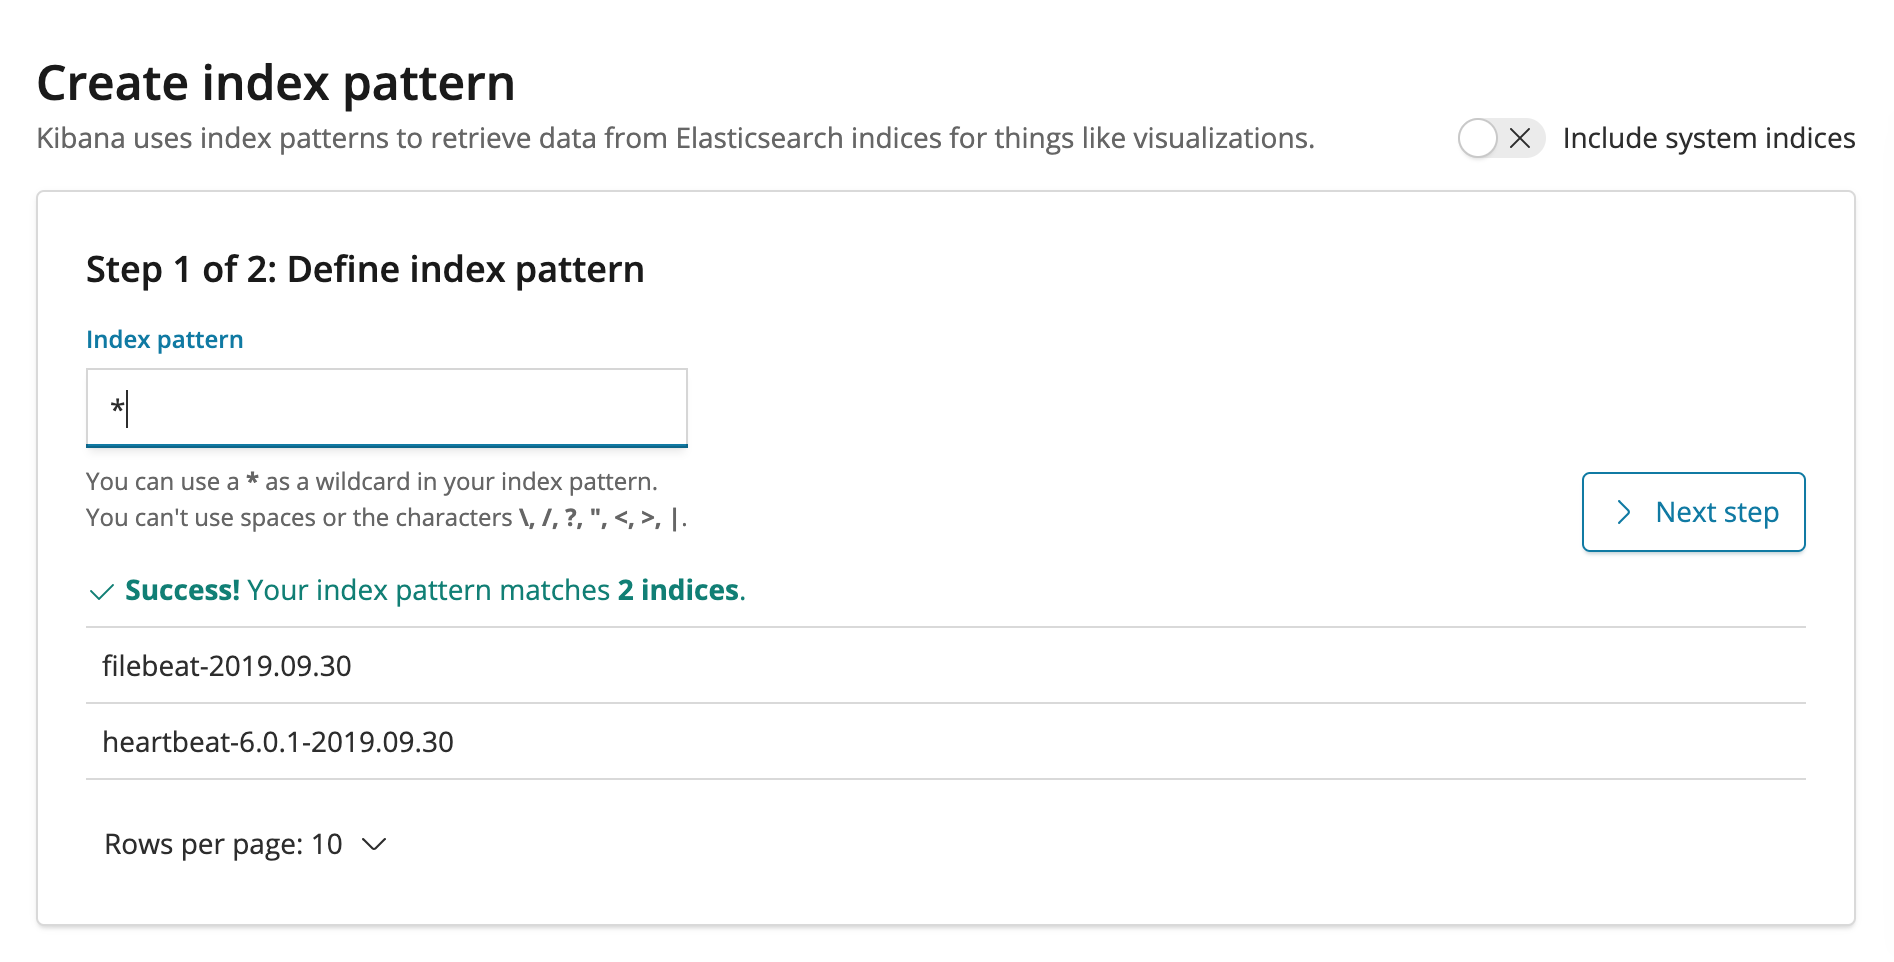
- Configure all matching index pattern: *
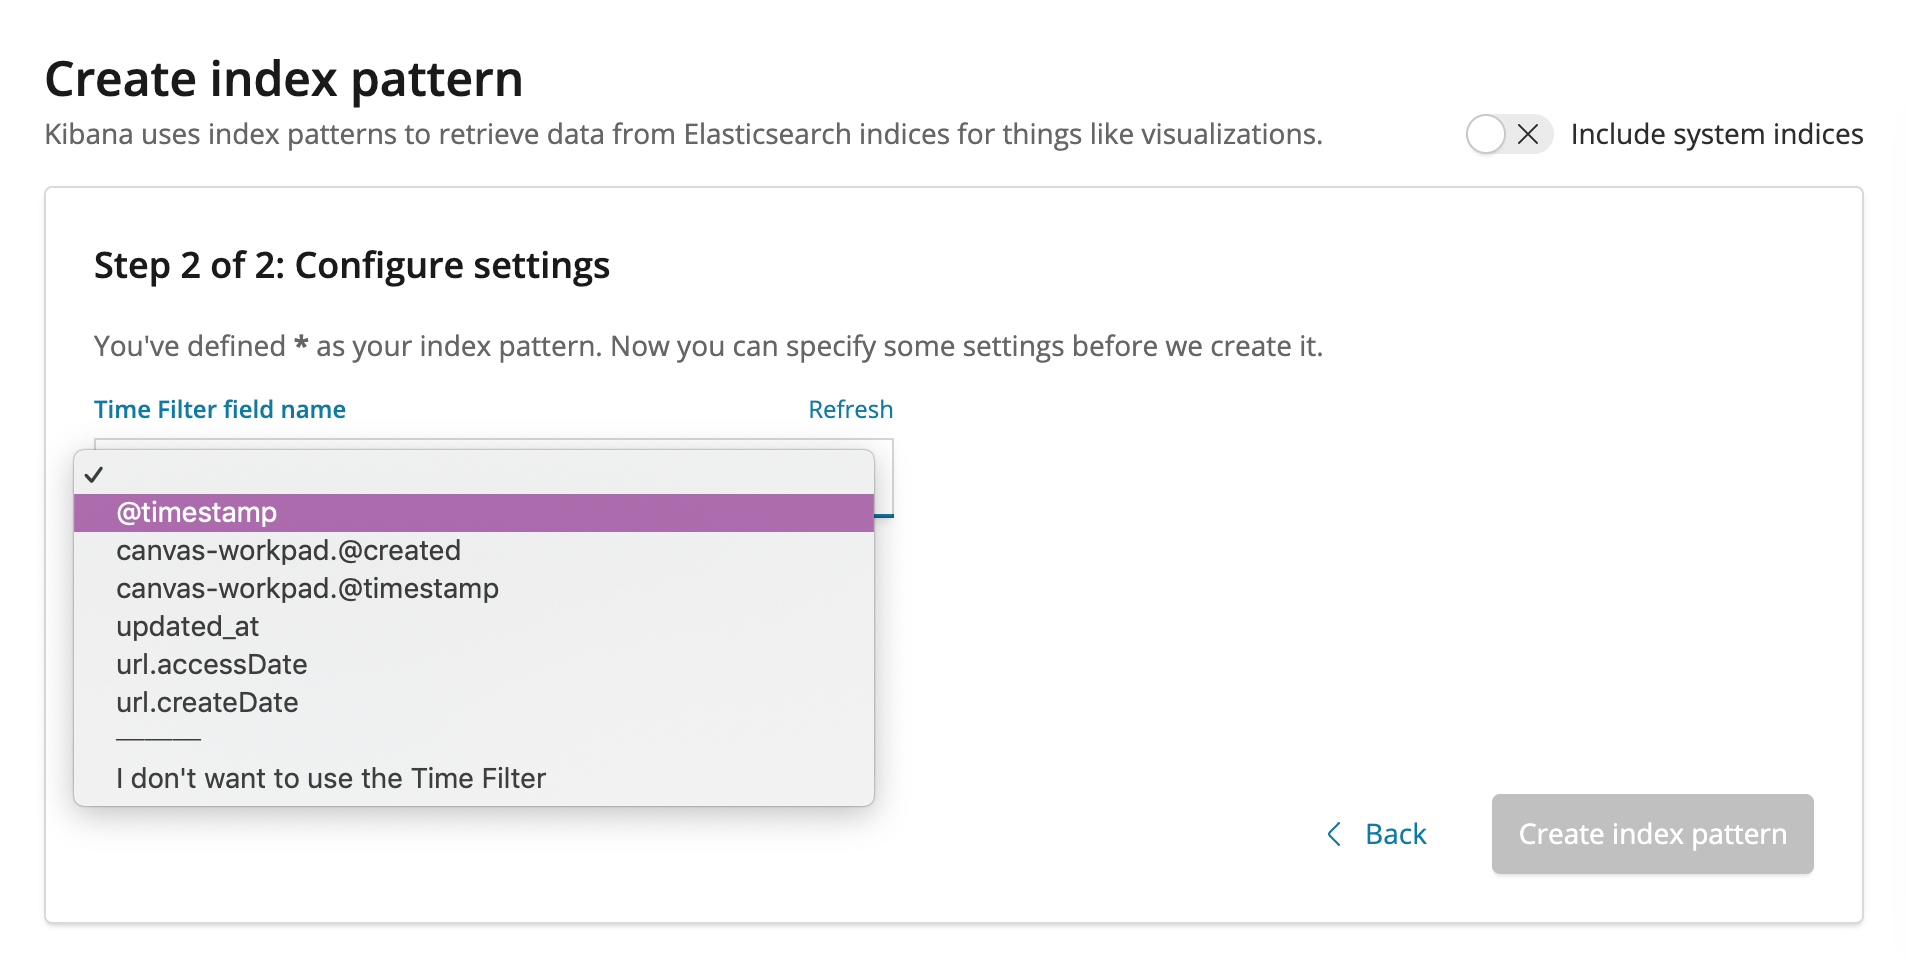
- Set Time Filter field name: @timestamp
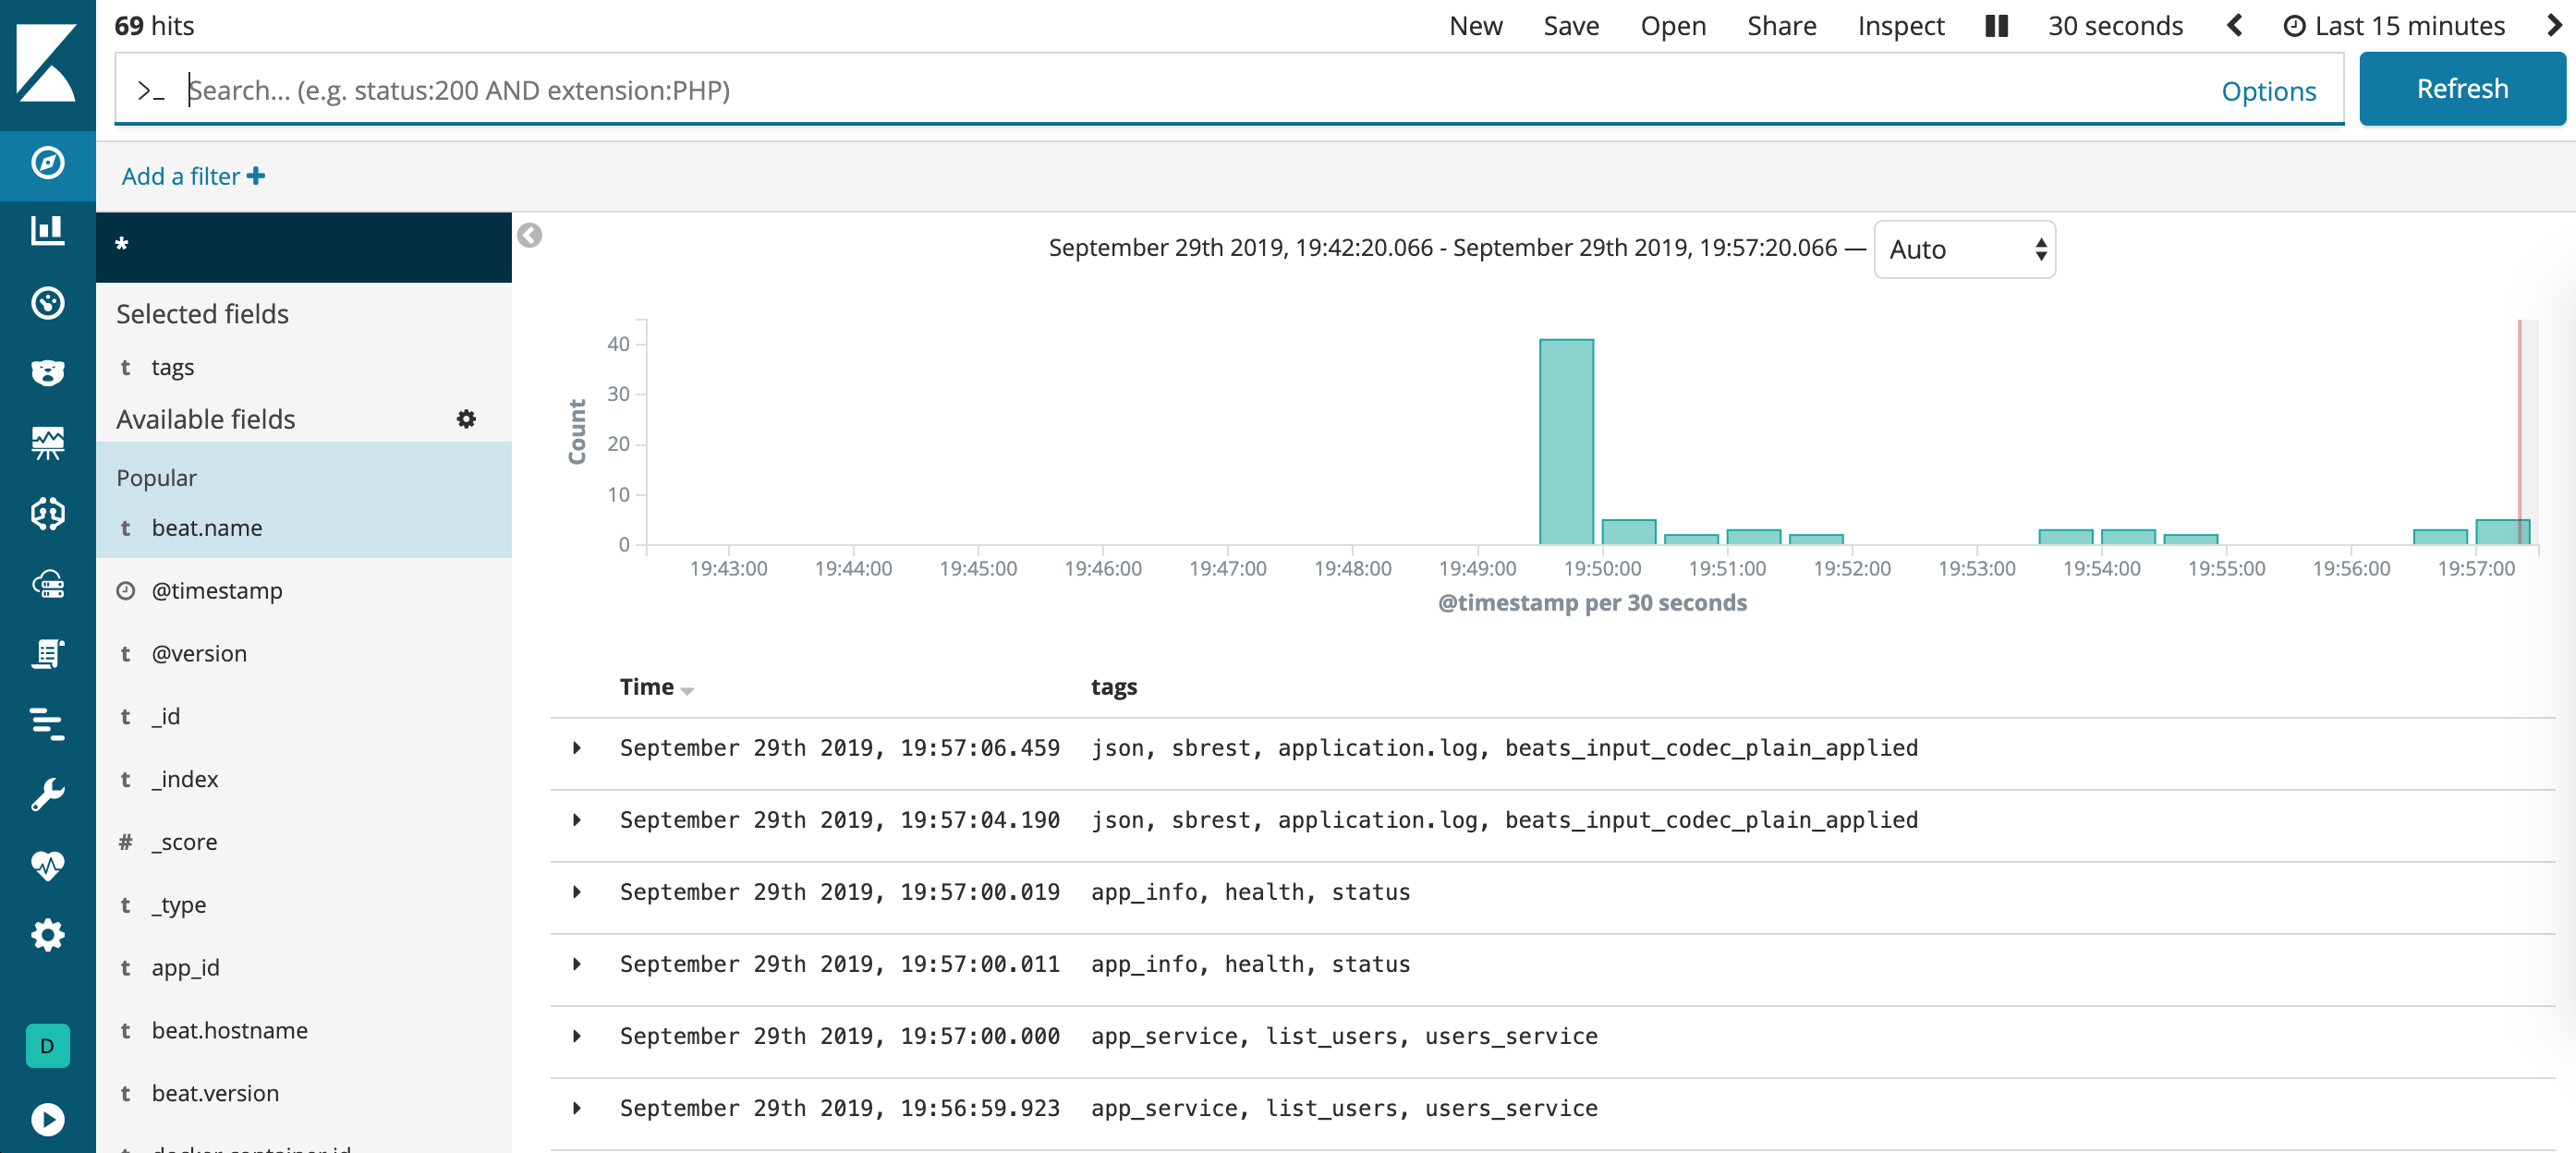
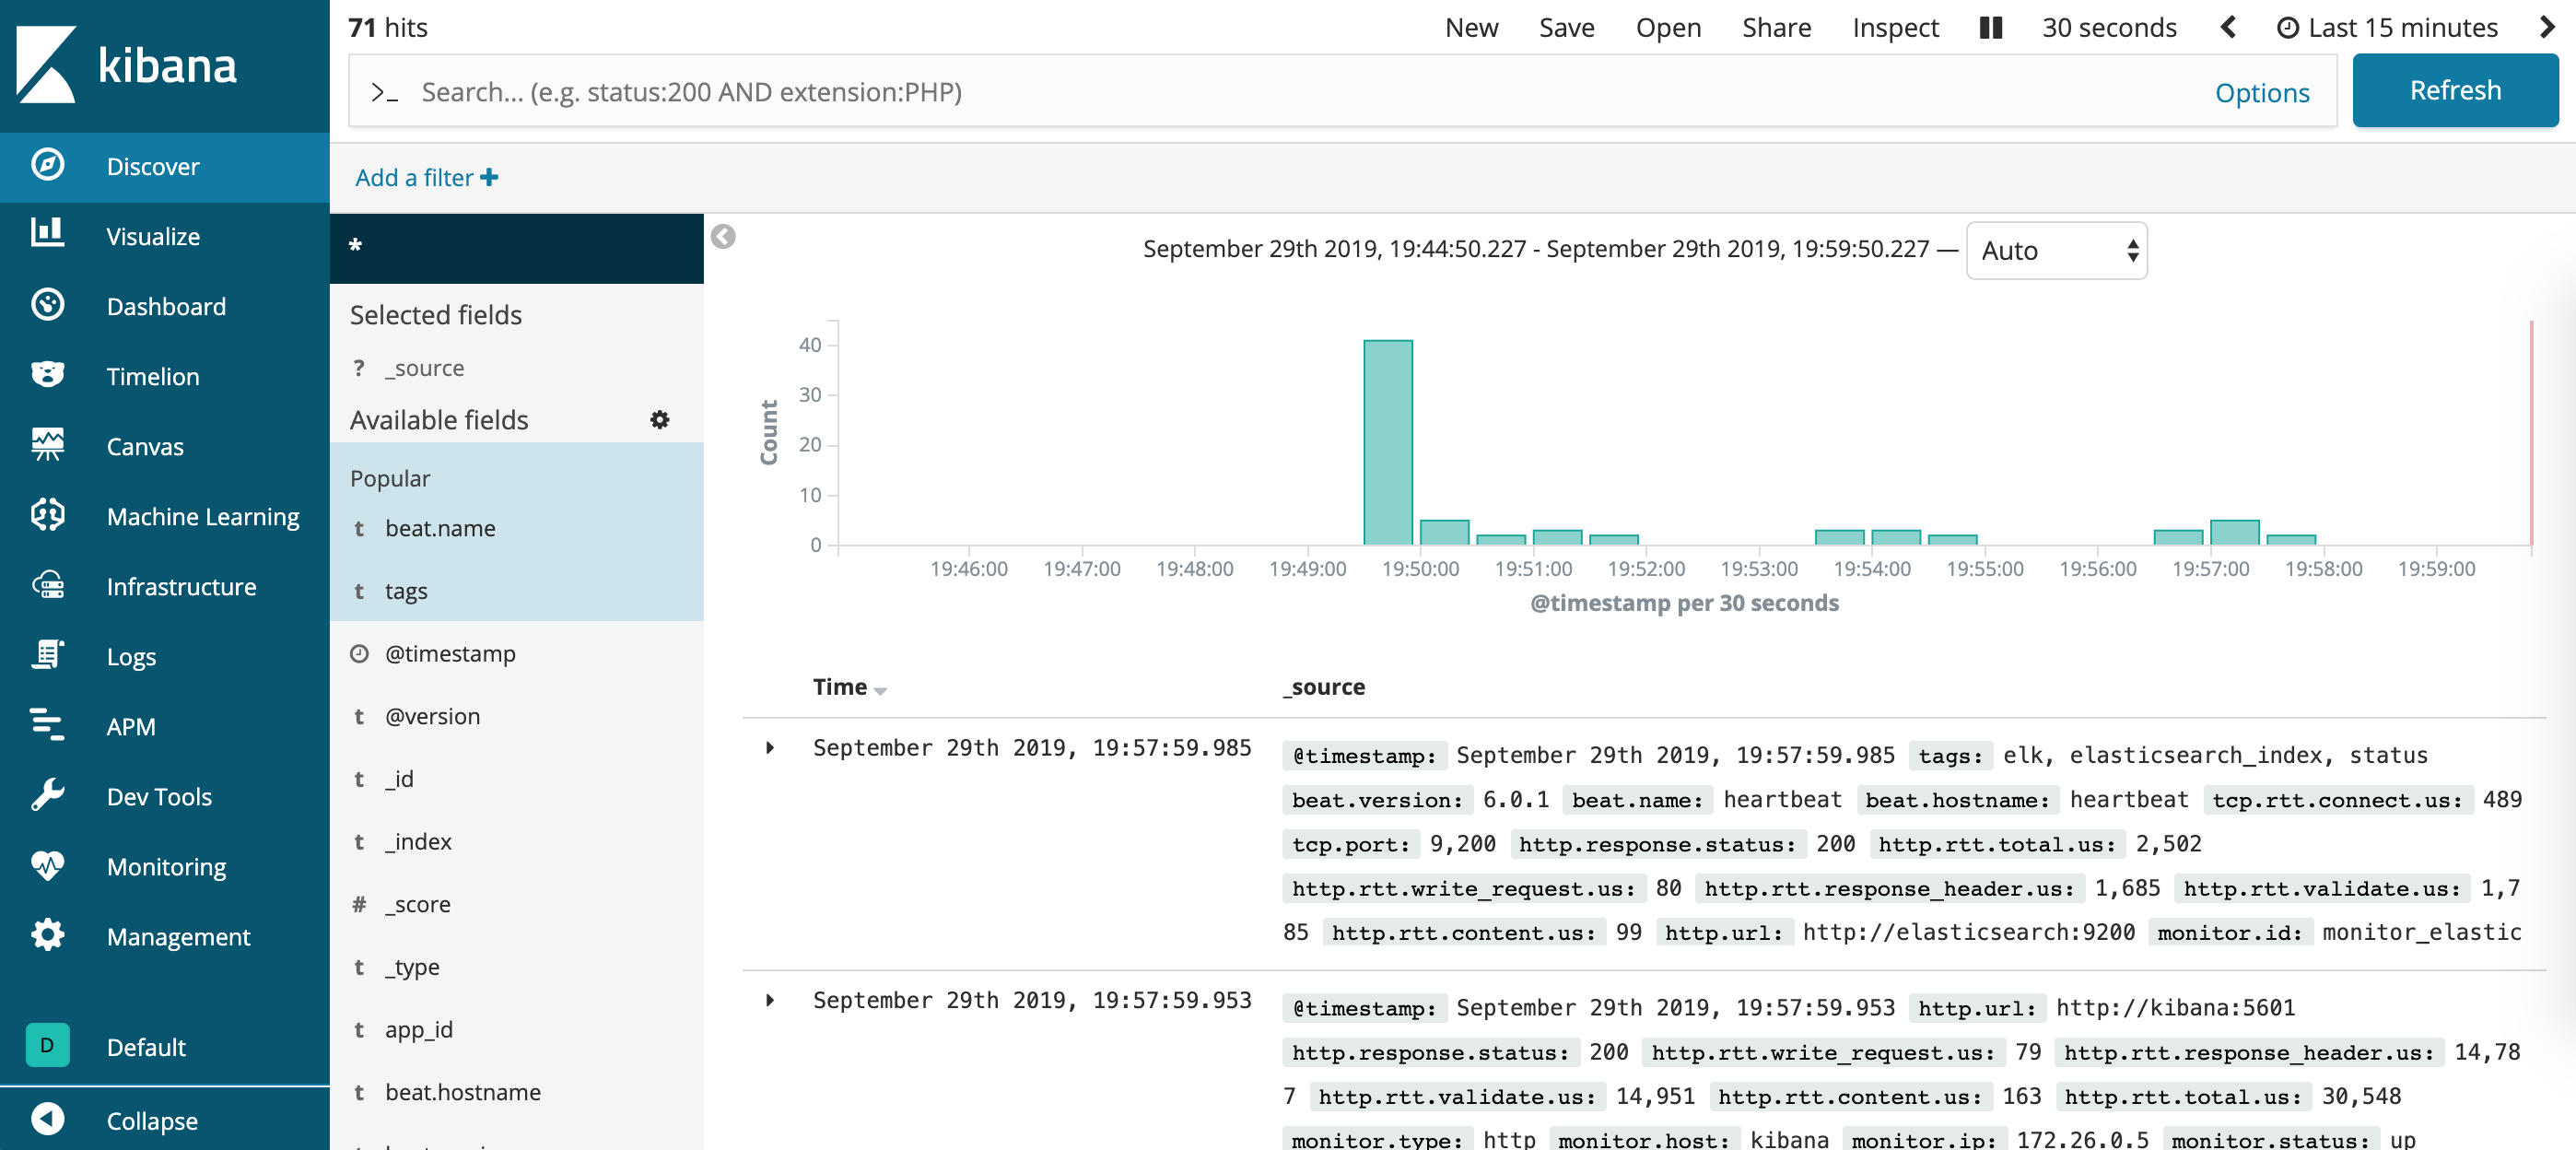
- Save and click Discover to visualize the current logs saved in ElasticSearch database.
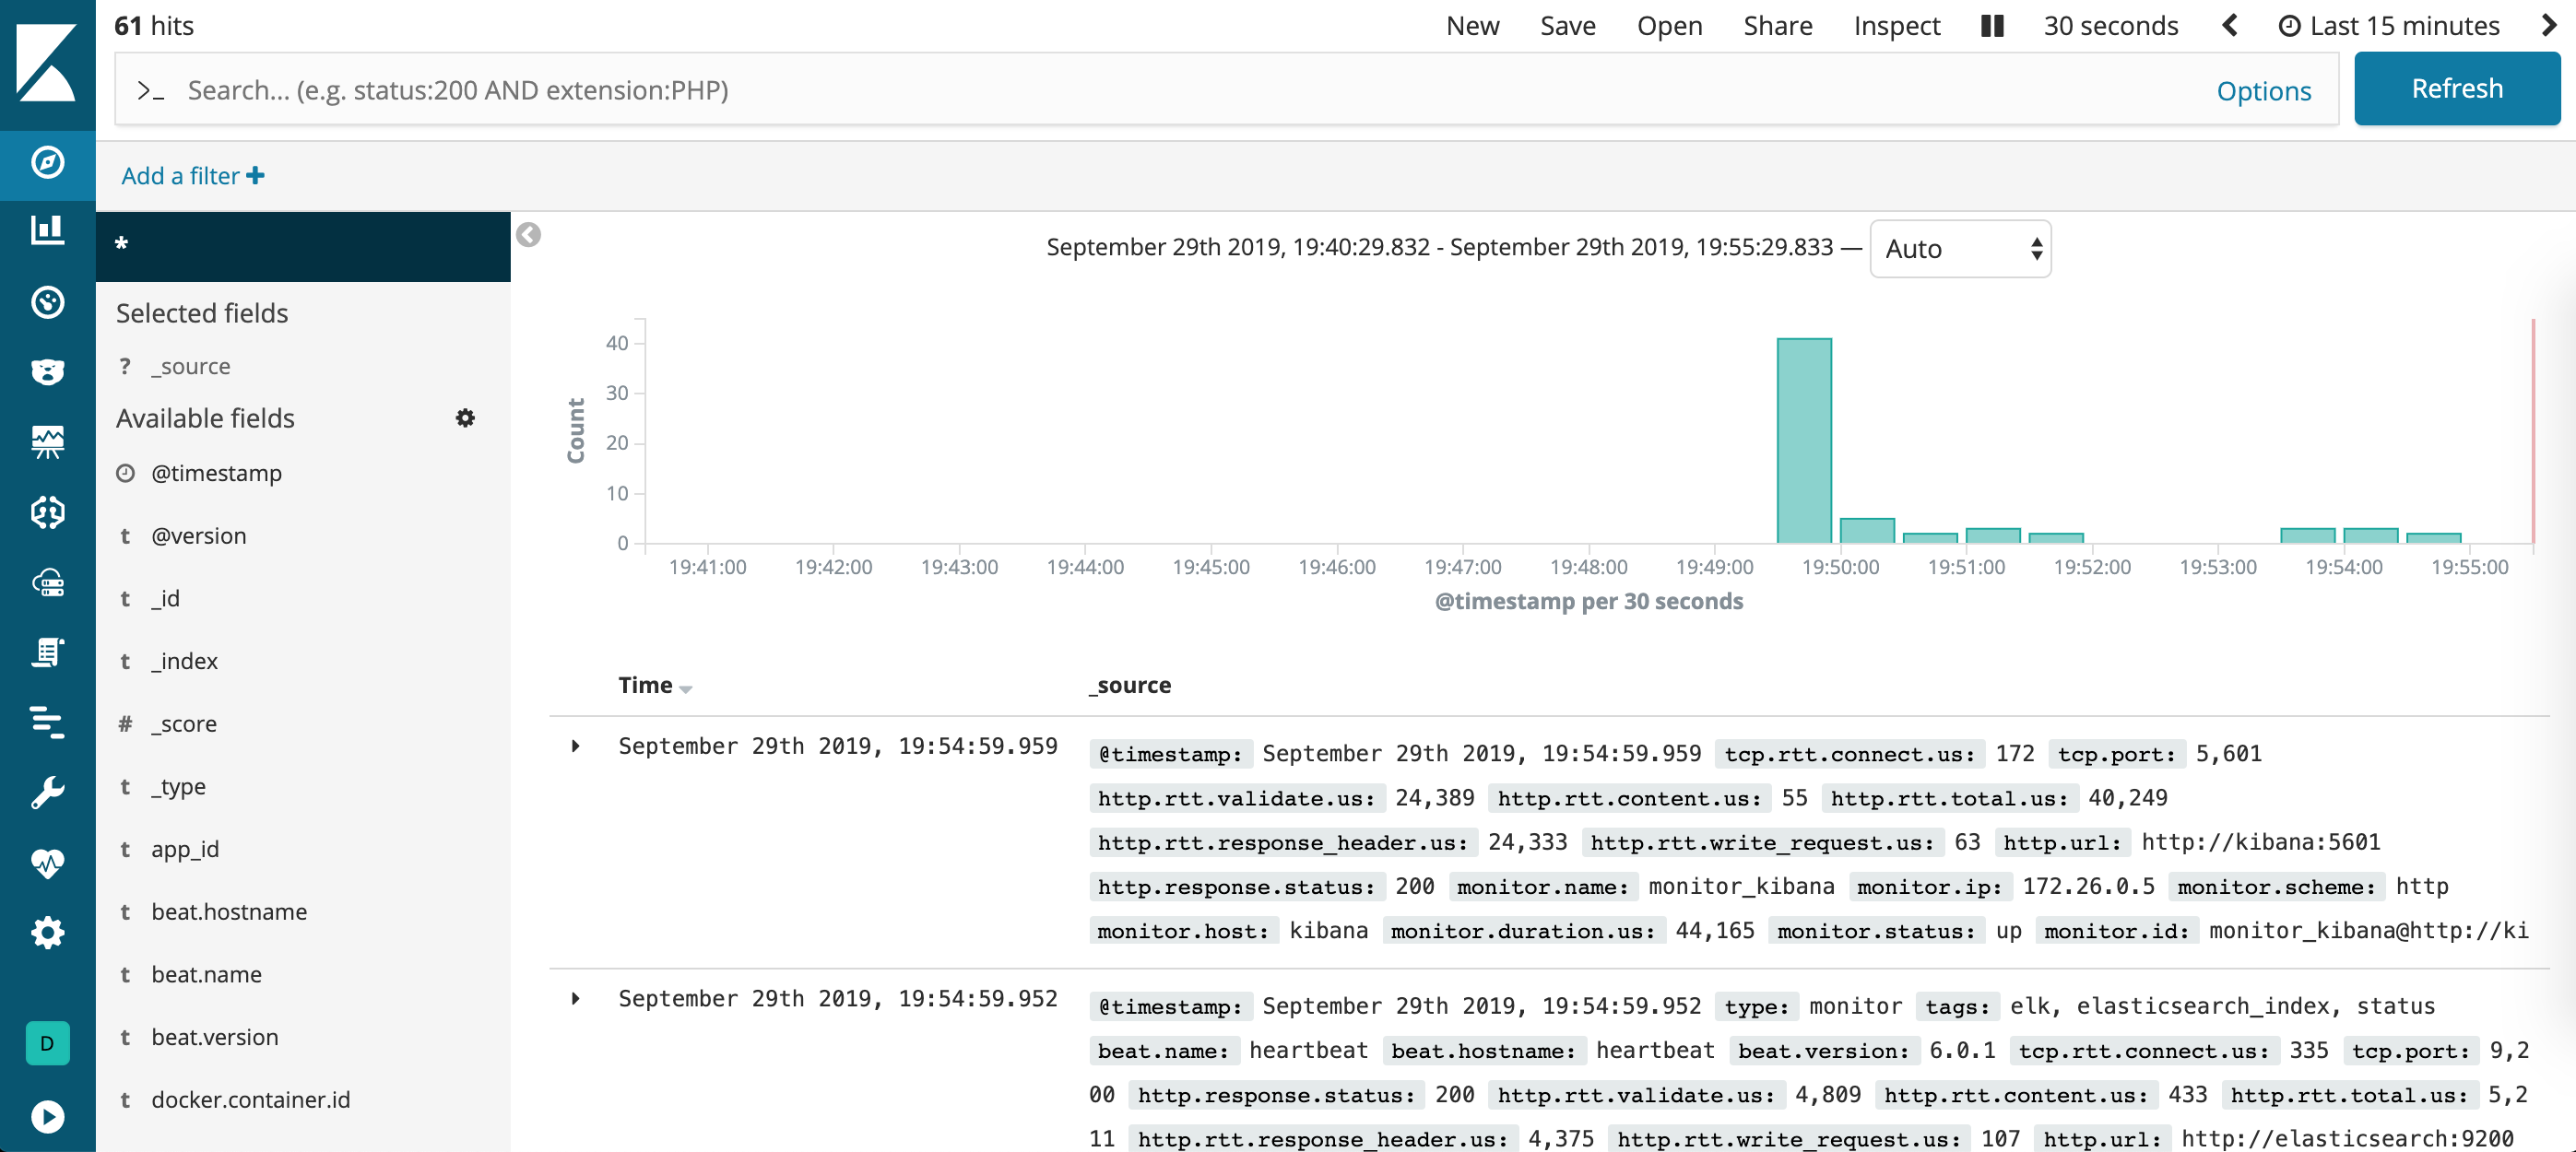
- Add some useful fields like tags to order the results.
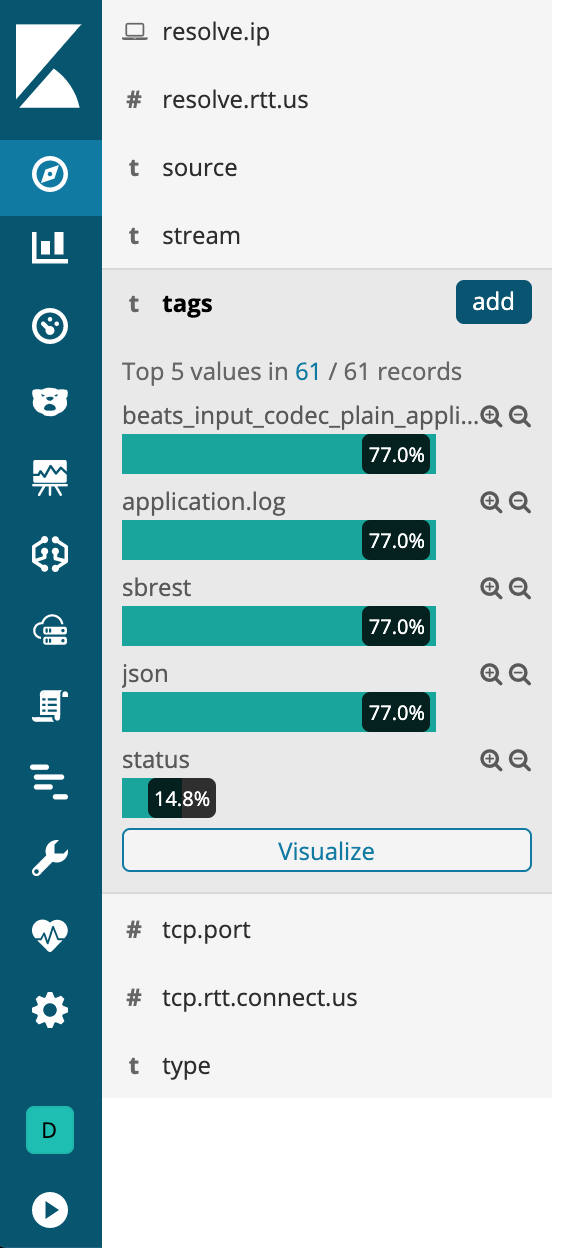
- Now enjoy logging with the ELK Stack.
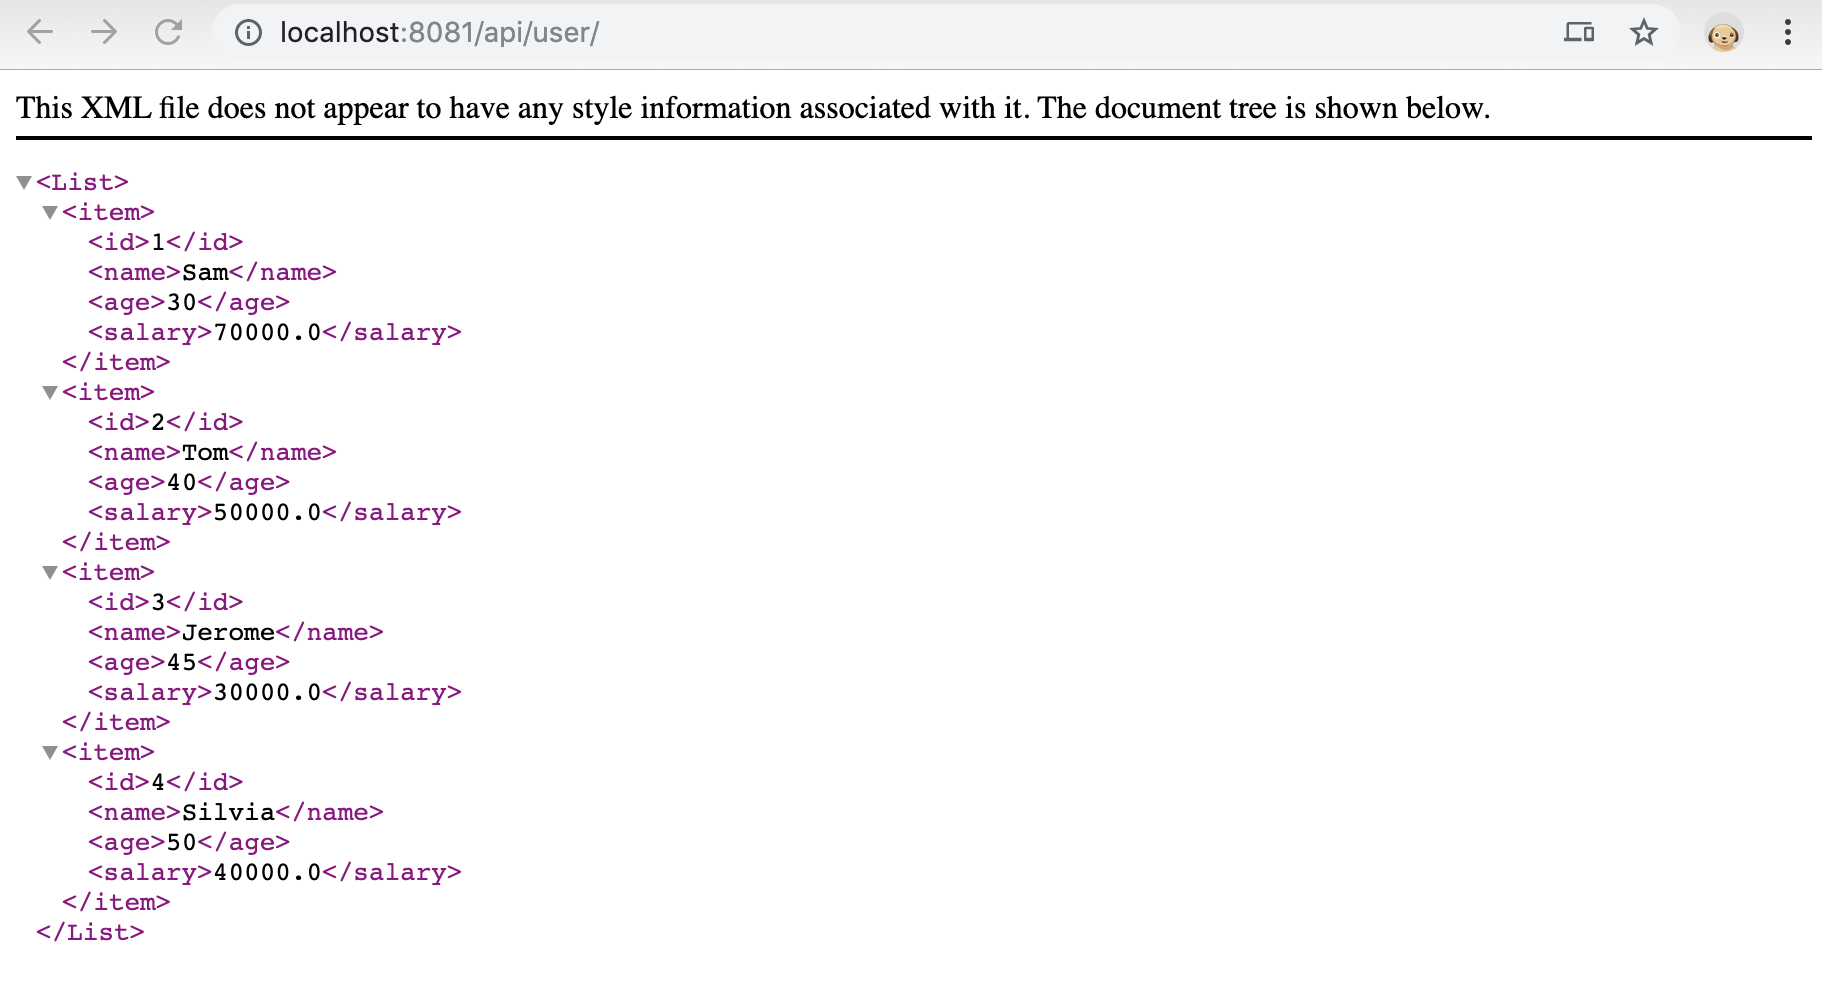
- spring: http://localhost:8081/api/user/
- kibana: http://localhost:5601
- elastic search
- logstah
- filebeat
- heartbeat
Logback configuration to send spring log file to elasticsearch through logstash.
/pom.xml
    ...
	<properties>
		<java.version>1.8</java.version>
	</properties>
    ...
	<dependencies>
        ...
		<dependency>
            <groupId>net.logstash.logback</groupId>
            <artifactId>logstash-logback-encoder</artifactId>
            <version>5.2</version>
            <scope>runtime</scope>
        </dependency>
	</dependencies>
...
/src/main/resources/application.yml)
server:
  port: 8080
  contextPath: /sbrest

logging:
file: logs/application.logLogs from Java will be send to logstash the to elasticsearch indexing.
/elk-filebeat/filebeat.yml)
filebeat.inputs:
   - type: log
    paths:
      - /logs/application.log
    tags: ["filebeat", "log_file"]
    ...
output.elasticsearch:
  hosts: ["elasticsearch:9200"]
...
# X-pack optional module
xpack.monitoring.enabled: true
xpack.monitoring.elasticsearch.hosts: ["host.docker.internal:9200"]Setting up services and endpoints to monitor HTTP status.
/elk-heartbeat/heartbeat.yml)
heartbeat.monitors:
# ELK monitors
...
- type: http
  schedule: '*/3 * * * * *'
  urls: ["http://elasticsearch:9200"]
  name: "monitor_elasticsearch"
  tags: ["elk", "elasticsearch_index", "status"]
...
# APP monitors
- type: http
  schedule: '*/1 * * * * *'
  urls: ["http://sbrest:8080/health"]
  check.response.status: 200
  name: "monitor_app_health"
  tags: ["app_info", "health", "status"]
...
# STACK setup
heartbeat.scheduler:
  limit: 1
output.elasticsearch:
  hosts: ["elasticsearch:9200"]
setup.kibana:
host: "kibana:5601"The input will come filebeat, then the events will filtered and send to elasticsearch.
/elk-logstash/logstash.conf)
input {

    file {
        path => "/logs/application.log"
        tags => ['sbrest', 'application.log']
        type => "logback"
    }
}

output {
    elasticsearch {
        hosts => ["elasticsearch:9200"]
        manage_template => false
        index => "logback-%{+YYYY.MM.dd}"
        document_type => "application.log"
   }
}Go to the folder /java-sbrest then run the following Docker commands.
docker build -t sbrest_only .
docker run --name sbrest_only --rm -v $PWD/logs:/logs -p 8082:8080 sbrest_onlyIf you are going to make changes into the source code and test those into the ELK enviroment. Remember to build the sbrest-0.1.jar.jar file, then copy it from /target into the /java-sbrest folder, or the changes wont be updated into the compose deployment.
    mvn dependency:tree
    mvn -Dtest=SpringBootRestTestClient test
    mvn package
    mvn spring-boot:run

    cp target/sbrest-0.1.jar java-sbrest/sbrest-0.1.jar

    # If the compose environment is running.
docker-compose up --detach --build sbrestTo try endpoints outputs in the logstash and filebeat monitoring apps, run any of this curl requests.
curl http://localhost:8081/api/user/
curl http://localhost:8081/api/user/2
curl http://localhost:8081/api/user/a
curl http://localhost:8081/api/user/99
curl http://localhost:8081/api/info
curl http://localhost:8081/api/debug

# This example will output a full java exception
curl http://localhost:8081/api/exception